Change Language :
Unsupported applications for short travels
The unsupported length has three distinct stages:
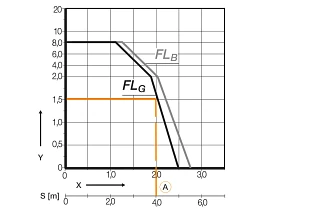
Use the load diagram to check the standard values for unsupported lengths

The values in the load diagram are important so that you can find a suitable energy chain for your filling weight and travel distance and determine the maximum load for the selected energy chain.
The black line in the load diagram indicates the area of the unsupported lengthFLG in which the energy chain has no slack. If the travel distance or the cable weight increases, the energy chain begins to sagFLB (light grey curve).
| Y Axis | X Axis | S |
|---|---|---|
| Fill weight [kg/m] | Unsupported length [m] | Travel [m] |
| 1.5 | 2.0 | 4.0 |
Preferred series for unsupported applications
What to do if the unsupported length is not sufficient?
If your application (fill weight, travel) falls outside the unsupported length range of the desired energy chain, you have the following options:
- Select a more stable energy chain
- Support the energy chain in the unsupported range. This option results in restrictions in terms of acceleration, speed and noise. Three basic examples are shown in the graph below. Please contact us if you are considering this option. We will be happy to make you a detailed proposal
- Use a multiband e-chain® or place two energy chains inside each other. (Please contact us)
- Designing the travel as a gliding application
Supports in the unsupported area unsupported with straight upper run and unsupported with permitted sag
The influence of speed and acceleration on service life
In unsupported applications, the acceleration (a) is the critical factor rather than the travelling speed (v). High accelerations can cause the energy chain to vibrate and impair the service life. This is particularly the case if the energy chain already has a sag greater than FLG . Maximum values for speed (v), acceleration (a) and service life can only be achieved with energy chains that are designed unsupported straight FLG. In this case, however, igus® e-chain systems can withstand very high loads. A peak value of 784 m/s2 acceleration has been achieved so far in continuous use.
| FLG | FLB | ||
|---|---|---|---|
| v max. | [m/s] | 20 | 3 |
| v peak | [m/s] | 50 | - |
| a max. | [m/s2] | 200 | 6 |
| a peak | [m/s2] | 784 | - |
Preferred series for maximum speed and acceleration
Consulting
I look forward to answering your questions

Dieter Reitz+49 2203 9649 7070Write e-mail
Shipping and consultation
In person:
Monday to Friday from 7 am - 8 pm.
Saturdays from 8 am- 12 pm.
Online:
24h
WhatsApp-Service:
Montag – Freitag: 8 – 16 Uhr


